


That Pollen Number Came Off a Roof, and Somebody Read It Under a Microscope the Next Day
The sampler sits above the trees to catch regional air, and a lab reads the slide a day later. Whatever made you sneeze this morning is not in it.
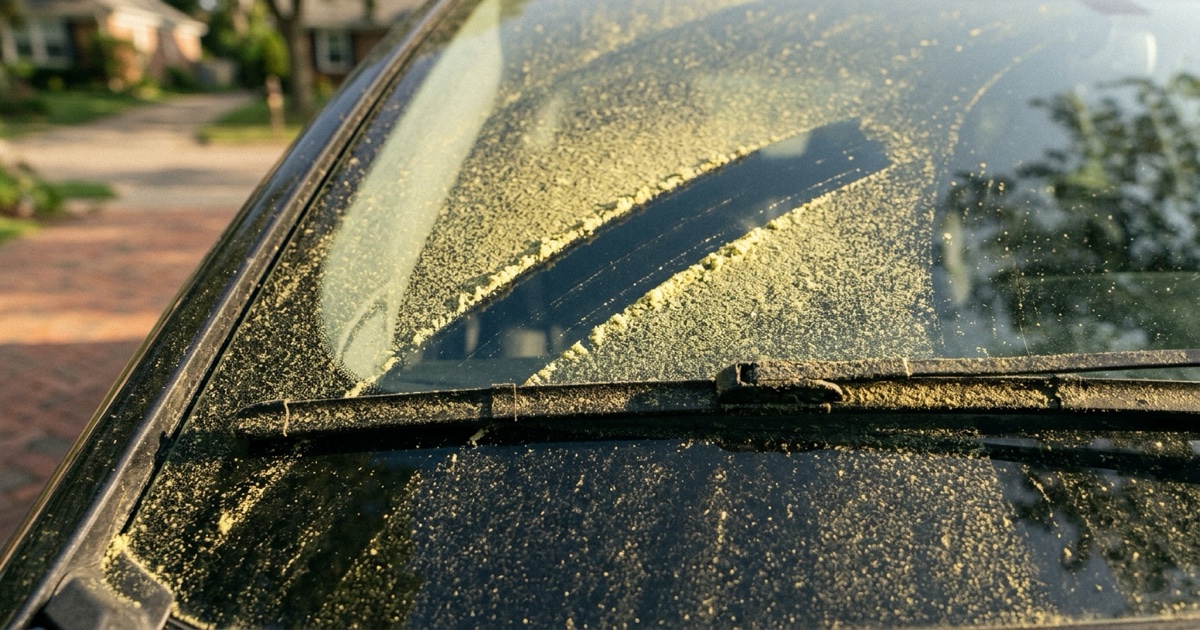
Table of contents
Summary of this article
- A pollen count is collected on a rooftop over 24 hours and counted afterward, so it describes yesterday over a wide area.
- A count is measured and a forecast is predicted. Your app rarely says which one you are looking at.
- High runs from 90 to nearly 1,500 grains, so two high days can differ by sixteen times.
- Low runs 0 to 14 and still contains pollen, which is how a low day makes somebody miserable.
- Categories roll up many species, so a low tree count can hide the one tree you react to.
- No federal agency runs an official pollen forecasting system. NOAA has one in development and calls it experimental.
- Use it for the season and the trend. Trust your own symptoms for the morning.
Why does the pollen forecast say low when your eyes disagree?
Because your morning happened on your street, and that number happened on a roof, and a person read it under a microscope the day after.
Here’s the morning. Keys in your hand, yellow film on your windshield thick enough to write your name in, one eye already going, and a phone in your pocket calling it a quiet day out there.
So we went looking for where that word gets made. The American Academy of Allergy, Asthma and Immunology describes an instrument on a rooftop, above trees and traffic, collecting for a 24-hour stretch and then carried indoors to a lab. What it counts is a cubic meter of air, about 35 cubic feet, a box a little over a yard on each side.
Somebody still has to read it. Forsyth County, North Carolina, runs a Rotorod sampler on a government building in downtown Winston-Salem. It works every weekday of pollen season, three in the morning until two in the afternoon. Greased rods spin through air and grains stick to them. County pollen specialists stain what came back so it shows up, count it under glass, and post a number that afternoon.
None of that’s sloppy. It is careful, slow, human work, and we’d trust it completely. It is also a description of air that sat above a downtown roof yesterday.
Roof height for that box of air. Car height for you, beside a hedge, downwind of one tree nobody sampled. As far as we’re concerned that gap is the whole argument.
What do low and high mean?
Low is the band where extremely sensitive people are still expected to be suffering. Somebody is always inside that word.
We’re not reading between lines here. National Allergy Bureau ranges carry a column headed “Those Who Will Likely Suffer Symptoms,” and low says “Only individuals extremely sensitive to this pollen.”
| What it says | Tree pollen, grains per cubic meter | Who will likely suffer symptoms |
|---|---|---|
| Low | 0 to 14 | Only individuals extremely sensitive to this pollen |
| Moderate | 15 to 89 | Many individuals sensitive to this pollen |
| High | 90 to 1,499 | Most individuals with any sensitivity to this pollen |
| Very high | 1,500 or more | Almost all individuals with any sensitivity to this pollen |
Now look at how far high runs in that Allergy Bureau table. It opens at 90 grains and doesn’t close until 1,499. Two days can both read high with sixteen times more pollen on one of them, and that word never flinches.
Bands also shift by plant, since the Allergy Bureau prints a separate set for each one. Grass hits high at 20 grains. Trees are still only moderate there.
What surprised us is where those edges came from, because it wasn’t anybody’s symptoms. Aeroallergen Network calculations cut them out of a pile of past counts, at the median, at the 75th percentile, at the 99th. Half of all counts stand under one line. Ninety-nine in a hundred stand under another. So bands describe a spread of past counts, then arrive on your phone dressed as advice about your afternoon, and that’s our quarrel with the word.
Whose air is being counted?
Somebody else’s, and from further off than we’d have guessed.
Luke Smith, Richard MacLehose and Jesse Berman went hunting for pollen figures to test whether thunderstorms drive asthma across Minnesota. They found one site. It stands in Minneapolis, near the airport, and certified counters employed by the Clinical Research Institute of Minneapolis read its slides. Minnesota has no other pollen measurement site, and they lined 19 cities up against that one.
Across the United States they put the national total at fewer than 60 stations, carried from work they cite rather than counted themselves. Sixty, for a country this size.
Distance does the rest of the damage. Earlier work Luke Smith and his coauthors point to found pollen looking about the same out to 19 miles. That sounds generous until you picture 19 miles of it. A river, a ridge, a different mix of trees, a whole other set of things flowering.
Equipment differs as well. Slides at one station, a spinning rod at another, an automated sampler from Burkard Scientific at a third. Federal paperwork behind a ragweed indicator says flatly that absolute pollen counts aren’t comparable across stations. So your city’s number and your sister’s aren’t the same kind of thing.
One line in that paperwork applies to every station regardless, that “Despite differences in sample collection, all sites rely on the human eye to identify and count spores on microscope slides.” It also grants that those technicians “are subject to human error,” and we’d rather have that on the record than not. A person is in this chain. People get tired.
Is anybody forecasting pollen federally?
No. Nobody is required to count pollen anywhere in this country, and no federal office forecasts it.
NOAA’s climate program office puts it in one sentence, that no federal agency has an official, dedicated pollen forecasting system. Weather has one. So does air quality. Pollen is not one of six pollutants EPA has to set a national limit for, so no national standard covers it at all.
Its Global Systems Laboratory is building an experimental one anyway, with a research institute the government pays for. They run pollen through a weather chemistry model that starts from a Steiner Lab dataset out of the University of Michigan, mapping what kinds of plants grow where. Experimental is their word, not our gloss on it.
One of the two things blocking that work is worth knowing, and we keep coming back to it. They can’t get real-time pollen figures to check a forecast against. The other obstacle is raw computing power.
Your app may be showing you either one, measured or predicted. Forsyth County puts both on one chart, today’s measured rating beside forecast ratings for four more days, in the same five words. Only a date separates them, and an app rarely puts one in front of us.
Can a low total hide the one plant you react to?
Yes, easily. A category is a bag of species with one word written on the outside.
Take a real afternoon in Forsyth County, North Carolina, written up by whoever counted it. “Today’s tree pollen level is in the LOW range (50% other trees and 50% pine family).” Half of what got counted was the pine family. If that is not your problem, half of that number was never about you, and whatever is about you got folded into what was left.
Paivi Salo, an allergy expert at NIH, states the ordinary case plainly, that “Most people with allergies are sensitive to more than one allergen. Grass, weed, and tree pollens are the most common causes of outdoor allergies.”
So a lot of averaging happens before one word reaches your screen. Some stations publish species rather than categories, and a species line is worth more to us than any category total. It matters most if a skin test, or ten springs of paying attention, already told you what your plant is. Most people never look, because an app shows one word and moves on.
When is it still worth checking?
It catches the turn of a season, and it catches that well.
Forsyth County sees cedar in February, oak peaking in April, and tree season closes in early June. Grass runs strongest in May and keeps on into September. Ragweed gets serious from late August through mid-September. Your county keeps its own calendar, since what floats past you depends on where you live and what month it is.
Weather moves it too, and you can read that part out a window. Hot, dry, windy days push more pollen up and keep it up there longer. Rain and still air pull it back down.
Trend beats any single day, so we’d still check it for that. If this week says heavier than last week, that tells us something real, and it’s roughly what an instrument on a roof was built to say.
What it can’t do is describe your walk to the car. A rooftop, yesterday, averaged across every species in a category, over a whole region. Not one of those four things is your morning.
What should you do about it?
Start with a date, because that one detail separates a measurement from a guess.
Check whether what you’re looking at was measured or predicted. If it won’t say, treat it as a guess.
Find your nearest station and see how far it stands from your bed. That distance is how much weight any of this has earned.
If your station publishes species, that is the line to read.
Then notice your own pattern. Salo’s advice on that is the plainest sentence in this whole subject. “Notice when and where your symptoms occur. This can help you figure out the cause.”
Federal health advice on the rest turns out to be mostly laundry. Shower when you come in. Change what you wore outside. Keep windows shut through your season. Don’t rub your eyes out there, and wash your hands before you touch them inside. If you want a high-efficiency filter in your HVAC, check your system takes one first.
None of it needs a number, and we’d rather hand you a habit than a band.
One last thing, and it turns this whole argument around. When that word says low, whoever wrote it’s already telling you that somebody extremely sensitive will likely be suffering. If that somebody is you, low was never an argument with your morning. It was a prediction of it.
Sources
- St. Louis County Pollen and Mold Center. Pollen Levels, National Allergy Bureau risk levels and what each means (2026)
- American Academy of Allergy, Asthma and Immunology. Allergy, Asthma and Immunology Glossary, pollen count and pollen forecast (2026)
- Journal of Exposure Science and Environmental Epidemiology. Smith ML, MacLehose RF, Berman JD. Thunderstorm asthma and pollen exposure across Minnesota city sites (2025)
- U.S. Environmental Protection Agency. Technical Documentation: Ragweed Pollen Season indicator (2024)
- Forsyth County, North Carolina. Environmental Affairs, Air Quality: Pollen counts and sampling schedule (2026)
- NOAA Climate Program Office. Tracking a new forecast: pollen edition (2026)
- Centers for Disease Control and Prevention. Pollen and Your Health (2026)
Questions people ask
Why does the pollen count say low when I have symptoms?
Low is not a claim that the air is clear. The National Allergy Bureau risk levels, as published by the St. Louis County Pollen and Mold Center, describe Low as the band where individuals extremely sensitive to that pollen will likely suffer symptoms. A Low reading and a bad morning are the pairing to expect if you are at the sensitive end.
Where do the pollen bands come from?
From the spread of past counts. The National Allergy Bureau report calculates its cut points by the median, the 75th percentile and the 99th. Those are descriptions of a dataset rather than doses worked back from a symptom threshold.
Is the pollen number a measurement or a forecast?
It can be either, and they are published in the same five words. The American Academy of Allergy, Asthma and Immunology describes counts as based on actual counts reflecting real-time weather, and a predicted forecast as built from previous years' pollen data and general weather forecasts. Only the date tells you which one you are looking at.
How close is the nearest pollen station?
Often nowhere near you. A 2025 paper in the Journal of Exposure Science and Environmental Epidemiology reports a single pollen measurement site in the whole state of Minnesota, and puts the national total at fewer than 60 stations. Earlier work it cites found pollen levels looking similar out to about 19 miles.
Can I compare the count in my city to another city's?
Not reliably. EPA's technical documentation for its ragweed indicator states that stations do not all use the same sampling method, so absolute pollen counts are not comparable across stations. The stations are run by a wide variety of organizations and not all of them report to the National Allergy Bureau.
Is there a federal limit for pollen?
No. Pollen is not one of EPA's criteria air pollutants, so no national ambient standard applies to it, and there is no official federal pollen forecast. NOAA has described work on an experimental one.
What should I do when the count says low and I still feel bad?
Treat your symptoms as the measurement. CDC guidance for people with pollen allergy is to check the forecast and limit time outdoors when levels are high, and NIH points at identifying which trigger is actually yours, since a total count can hide the one plant you react to.
Have questions about the environment inside your home?
Air quality, mold, EMF, light and water all shape how a house feels and how the people in it feel. Whatever your concern is, the first step is finding out what is there.
Our certified team of environmental professionals and advocates can help.