


The Color on Your Air Quality App Is a Forecast, and Your Town May Have No Monitor at All
A live measurement also exists, and it appears in the same color in the same app. Nothing emits ozone; sunlight builds it, so it peaks on hot clear afternoons.
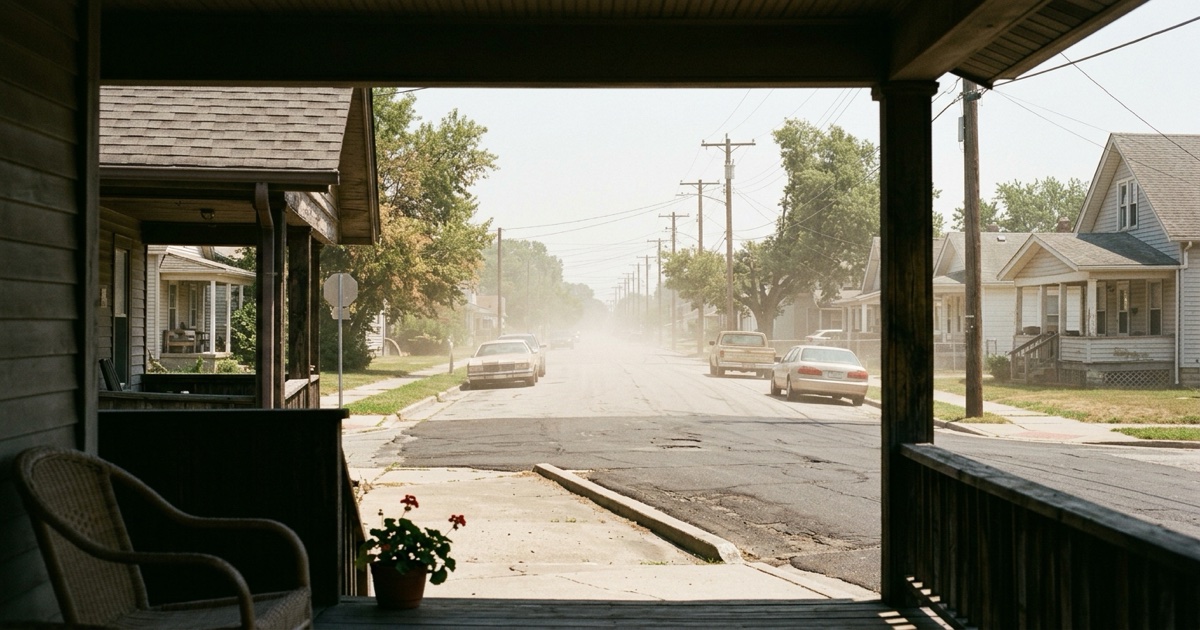
Table of contents
- Why does a clear blue afternoon leave your chest tight?
- Why is your suburb breathing what downtown made?
- Is your air quality app guessing?
- Whose air does that color describe?
- What if your town has no monitor at all?
- Does anybody watch ozone outside summer?
- Why can a bad hour still be a legal day?
- What should you do on a hot bright afternoon?
Summary of this article
- Nothing emits ozone. Sunlight builds it out of chemicals already in the air, so it peaks on hot clear afternoons.
- The value on your app is usually a forecast. EPA calls it a prediction, made by state forecasters the day before.
- A separate live number exists, and both appear in the same color in the same app.
- The figure comes from the worst monitor in a whole reporting area, which can be an entire metro region rather than your street.
- Areas under 350,000 people are not required to report it at all, and much of the country stops measuring ozone outside the warm months.
- The federal standard is an 8-hour average, so a bad hour can pass while the average stays legal.
- Shift outdoor exercise to early morning rather than cancelling it. That is a bigger difference than most people expect.
Why does a clear blue afternoon leave your chest tight?
Sunlight builds ozone out of fumes that went up hours earlier, so it peaks when the weather looks its best.
Four o’clock on a hot July day. The sky’s a clean pale blue, no haze in it, nothing to smell. You walk up a hill you walk up every week, and near the top your chest goes tight and your throat catches.
Nothing puffed that at you. No tailpipe, no chimney, no stack behind a fence.
What caught your throat got built rather than released. Exhaust from cars, power plants, industrial boilers, refineries and chemical plants goes up into the morning air. The sun works on it for a few hours. Ozone is what comes back down.
Which makes it a strange one among pollutants. It needs good weather. Hot, bright and still is a recipe, and gray and wet ruins it.
Timing follows from that. Warm months, roughly April through October, and afternoon into early evening in most places. Morning on that very day can be clean. The same street, the same lungs, a few more hours of sun on it.
It climbs on cold sunny days as well, so summer is a pattern and not a rule, and we’d rather you carried it that way round.
Why is your suburb breathing what downtown made?
Because building ozone takes hours, and the air keeps moving while it happens.
Morning traffic loads a city’s air with exhaust. Wind pushes that air out across rooftops, over yards, and on across fields. The sun finishes its work somewhere along that ride. Whatever left a downtown on-ramp at eight becomes ozone over a county where nobody is idling, and that county may well be yours.
Federal siting rules take this for granted. They tell whoever runs the monitors in a state to hunt for a metro’s worst ozone in whichever direction is most likely to carry it, and they add that such sites “will be located 10 to 30 miles or more downwind from the urban area where maximum O3 precursor emissions originate.”
Read that twice. A city’s worst ozone is expected to come down 10 to 30 miles outside the city itself.
So a road with one traffic light on it can run dirtier than a street full of buses. Wind moves ozone long distances, which is why the countryside gets it too, sometimes blown in from a city upwind. We find this is where people go wrong. You picture pollution thickest at its source, when this one needs travel time and sun before it turns into the thing that gets you.
Drive out of town on a hot Saturday to get away from city air and you’re doing something sensible that doesn’t work the way you think. We have done it ourselves, more than once.
Is your air quality app guessing?
Yes, on most days. Somebody wrote today’s value yesterday afternoon.
Picture the person who writes your color. A state or local air agency, after lunch, one forecaster deciding what tomorrow is going to do. Weather models on one screen. Satellite images. What the monitors have been doing all week. Computer models of how pollution travels on air. Plus their own read on how pollution behaves in certain communities, which is knowledge you only get by watching one place for years.
Then they make the call. Ozone forecasts for more than 350 cities go up daily at 4:30 PM through summer.
Skilled work, and we’d call it honest about what it is. AirNow’s own comparison is a weather forecast telling you whether to pack an umbrella.
A live version runs alongside it. Hourly readings off the monitors feed something called NowCast, which describes hours already gone rather than hours ahead.
One is a call made before your day started. The other sums up a morning you already breathed. Each matters, and both arrive inside one color on one app, and almost nothing on that screen says which you’re looking at. We’d hunt for the word forecast or current before trusting either.
Whose air does that color describe?
Not yours. Your whole area gets published through its single worst monitor.
Step one of the official instructions is to “Identify the highest concentration among all of the monitors within each reporting area”, and one of those areas can cover an entire metro region.
We would defend that design. Something built to warn people shouldn’t average away the one spot where air went bad.
It does mean none of it’s about your street. Live across town from whichever monitor peaked, in another valley with its own traffic and its own weather, and your afternoon can be far better than your phone suggests. Nothing on that screen tells you so.
It runs backwards too. A house beside a highway, maybe yours, can run worse than anything published, because nobody put an instrument on that block.
Our own habit is to take it as a regional bulletin rather than something measured in your yard. That is what it was built to be.
What if your town has no monitor at all?
Nobody has to give you one.
Live in a metro area above 350,000 people and somebody has to publish daily. Below that, the federal wording is blunt. “Towns and cities with 350,000 or fewer inhabitants are not required to report the AQI. Some may not have monitors. AirNow is voluntary on top of that, so some state or local monitoring agencies may not submit data to it at all.”
Minimums for monitors run thinner than you would guess.
| People in a metro area | Ozone monitors required |
|---|---|
| More than 10 million | 4, or 2 where recent air ran under 85% of a standard |
| 4 to 10 million | 3, or 1 |
| 350,000 to under 4 million | 2, or 1 |
| 50,000 to under 350,000 | 1, or none |
That bottom row is worth knowing about before you trust a value in a small town. A city of a quarter million with a clean history can be required to run no ozone monitors at all.
And which towns fall into that band? Small and mid-sized ones. Which is to say, the towns you find 10 to 30 miles downwind of somewhere big. That pairing surprised us more than anything else in the rulebook.
Does anybody watch ozone outside summer?
Depends which state you’re standing in.
Monitors are required only through the seasons “conducive to O3 formation”, and a table in federal rules sets those months for each state in turn.
Arizona, California and Florida run January to December. Michigan, New York and Ohio run March to October. Texas runs March to November in the north and all year in its southern parts. Washington runs May to September, which is four months of the year and eight without.
Sensible on its face. Ozone wants sun, and a Washington January isn’t where a state would spend money. We’d have made the same call.
Then a warm, bright, still week arrives in April. That is ozone weather, and in Washington April is a month nobody has to be watching. Freak weather is what builds this stuff, and a season chart can’t cover freak weather. It took us a while to spot that gap, and you won’t unsee it afterwards.
The same logic runs the other way in the mountain West, where high elevation and long sun push ozone into months a coastal state would call spring. And it runs sideways in places with wildfire smoke, which arrives with its own chemistry on days a season chart calls quiet. A calendar drawn for the average state is wrong in every state that isn’t average.
Why can a bad hour still be a legal day?
Because a federal ozone limit is an average, and a long one.
That limit is 0.070 parts per million over 8 hours, and EPA set it in 2015. Its official form goes further, printing the whole mouthful as an “Annual fourth-highest daily maximum 8-hour concentration, averaged over 3 years.”
Take that slowly and you can see what it’s for. It rates a place across three years. It was never built to judge your Tuesday. Even the daily maximum comes out of 17 rolling 8-hour windows, the first running 7am to 3pm.
Fair enough for chronic exposure. Less use to somebody with asthma standing outside at five in the afternoon, reacting to that hour rather than to a mean of eight of them.
EPA won’t run its own index fast, either, and says why. It advises against putting AQI values on realtime sensor data, especially 1-minute readings, because health studies don’t tell us what a single minute of exposure to a pollutant does to anybody. Own a home air sensor? Your minute-by-minute display is watching something real that no health study has priced.
None of this is frozen, though. Detroit, Muskegon and Berrien went onto a failing list in 2018, and this July a federal proposal moved to take all three off it, because “All air monitors in these three areas show air quality now meets the national ozone standard.”
Those monitors are how anybody knew either way, us included.
What should you do on a hot bright afternoon?
Move it to the morning. That is most of your answer, and it costs nothing.
Federal advice for people at higher risk comes down to one line: “Plan outdoor activities in the morning when ozone is lower.”
Who counts as higher risk is wider than we expected, and you may be on that list without thinking of yourself as fragile. Lung disease such as asthma. Older adults. Children and teenagers. And anyone active outdoors, which puts a fit runner on that list next to somebody’s grandmother.
So check a forecast in the morning when your afternoon involves working hard outside. A run at seven and the same run at five are two different propositions on one day.
Shift it rather than cancel it, is our advice. Early morning is the cleanest air of a hot day, and that gap surprises people who try it.
Live downwind of a city and take a hot still afternoon more seriously than downtown is being told to. Your patch is where the peak was always expected to settle.
Your own chest beats any published value for your street, in any case, and we’d put more weight on it than on anything we can hand you. Nobody put an instrument on your block, and nobody is going to.
One last thing, plainly. The prettiest day of summer is when your air is at its worst, and nothing you can see says so. Blue sky. No smell. A color on your phone that somebody chose yesterday afternoon for a whole metro, out of whichever monitor happened to have a bad day. Nothing about how that day looks tells you a thing, and that’s the whole reason anybody forecasts it. Your throat knows more about your street than any of it does.
Sources
- U.S. Environmental Protection Agency. Ground-level Ozone Basics (2026)
- U.S. Environmental Protection Agency. Technical Assistance Document for the Reporting of Daily Air Quality - the Air Quality Index (AQI) (2026) EPA-403/B-26-003
- U.S. Environmental Protection Agency. Patient Exposure and the Air Quality Index (2026)
- AirNow (U.S. Environmental Protection Agency). Air Quality Guide for Ozone (2023) EPA-452/F-23-001
- AirNow (U.S. Environmental Protection Agency). Using the Air Quality Index (2026)
- U.S. Environmental Protection Agency. NAAQS Table (2026)
- U.S. Government Publishing Office. 40 CFR Part 58, Appendix D - Network Design Criteria for Ambient Air Quality Monitoring (2024) 40 CFR part 58, App. D
- U.S. Environmental Protection Agency. Green Book Summary Nonattainment Area Population Exposure Report (2026)
- U.S. Environmental Protection Agency. EPA Proposes Ozone Redesignations in Michigan for Muskegon County, Berrien County, and Detroit Area After Significant Pollution Reductions (2026)
Questions people ask
Is the ozone number on my weather app a measurement?
Usually not. EPA defines an AQI forecast as a prediction of the day's air quality using AQI colors and scale, issued by state, Tribal and local air quality forecasters in the afternoon for the next day. Current-hour NowCast values are the ones built from monitor readings.
Why is ozone worse on hot afternoons?
Ozone is not emitted directly. EPA states it forms when nitrogen oxides and volatile organic compounds react in sunlight, and that it is most likely to reach unhealthy levels on hot sunny days in urban environments. Levels peak in the afternoon and early evening for most locations.
Does the AQI describe the air at my address?
No. EPA's first step in calculating the AQI is to identify the highest concentration among all of the monitors within each reporting area. The value describes a whole reporting area through its worst monitor, which may sit on the far side of the metro from your house.
Why doesn't my town report an air quality index value?
EPA's FAQ answer is that towns and cities with 350,000 or fewer inhabitants are not required to report the AQI, some may not have monitors, and AirNow is a voluntary program that some state or local agencies do not submit data to.
Are there ozone monitors everywhere in the country?
No. Table D-2 of 40 CFR Part 58, Appendix D sets minimums by metro population. A metro area of 50,000 to under 350,000 people whose most recent 3-year design value sits below 85% of an ozone standard is required to operate no ozone monitors at all.
Is ozone measured year-round?
Not everywhere. 40 CFR Part 58, Appendix D requires ozone monitoring only during the seasons conducive to ozone formation, listed state by state in Table D-3. Washington runs May through September, Michigan March through October, and Arizona, California and Florida run January through December.
What is the federal ozone standard?
0.070 parts per million over 8 hours, primary and secondary, set in 2015. EPA states its form as the annual fourth-highest daily maximum 8-hour concentration, averaged over 3 years. It is a regulatory limit that rates a place over three years, not a verdict on one afternoon.



Have questions about the environment inside your home?
Air quality, mold, EMF, light and water all shape how a house feels and how the people in it feel. Whatever your concern is, the first step is finding out what is there.
Our certified team of environmental professionals and advocates can help.